Code coverage in end-to-end/integration Go tests
I like writing integration tests for my Go code. They give me confidence that everything works as expected. This was one of the reasons I built Gnomock (an integration and end-to-end toolkit based on Docker): to easily write tests for code that uses databases or other external services, like AWS S3 or Splunk.
Update 2022-02-11: I also like viewing coverage reports with comfort, so I wrote gocovsh as well: a Go coverage viewer for the CLI. More about it down below.
I often put integration and end-to-end tests either into a separate package, or
into the main package (main_test in the project root). I had one problem
with it: code coverage reports were not good enough, they skipped entire
packages and gave unexpected results. This was the default behavior when using
the following command:
In the next examples, I will use a demo app, which has an integration test, and two packages:
modelsandhandlers.
$ go test -race -cover

PASS
coverage: 0.0% of statements
ok      github.com/orlangure/crud-demo  20.876s
My tests took 20 seconds to run, but no code was covered, which I knew was
wrong. The issue was that the coverage report ignored sub-packages
(models and handlers), which had all the important things in them.
Turns out there is a -coverpkg flag that allows to select a package for the
coverage report:
$ go test -race -cover -coverpkg ./handlers

PASS
coverage: 58.1% of statements in ./handlers
ok      github.com/orlangure/crud-demo  20.617s
It is even possible to report coverage for all sub-packages:
$ go test -race -cover -coverpkg ./...

PASS
coverage: 58.7% of statements in ./...
ok      github.com/orlangure/crud-demo  19.845s
This information is more useful than coverage: 0.0%, but not useful enough.
To add more details, coverage report can be saved into a file for further
processing:
$ go test -race -cover -coverpkg ./... -coverprofile coverage.out

PASS
coverage: 58.7% of statements in ./...
ok      github.com/orlangure/crud-demo  21.038s
The output looks the same, but a new file appears in the current directory. We can extract a more detailed report from it:
$ go tool cover -func coverage.out

<skipped>/handlers/handlers.go:14: CreateThingHandler      63.6%
<skipped>/handlers/handlers.go:36: GetThingByNameHandler   57.1%
<skipped>/handlers/handlers.go:63: GetThingByIDHandler     55.6%
<skipped>/main.go:14:              main                    0.0%
<skipped>/models/things.go:19:     String                  0.0%
<skipped>/models/things.go:24:     Connect                 75.0%
<skipped>/models/things.go:39:     CreateThing             80.0%
<skipped>/models/things.go:54:     GetThingByName          85.7%
<skipped>/models/things.go:74:     GetThingByID            85.7%
total:                             (statements)            58.7%
From this report it is clear that String function from things.go file has
zero coverage. This can be improved easily by adding another test. What about
other functions with non-zero coverage? What did the tests miss?
There is another useful go tool feature:
$ go tool cover -html coverage.out
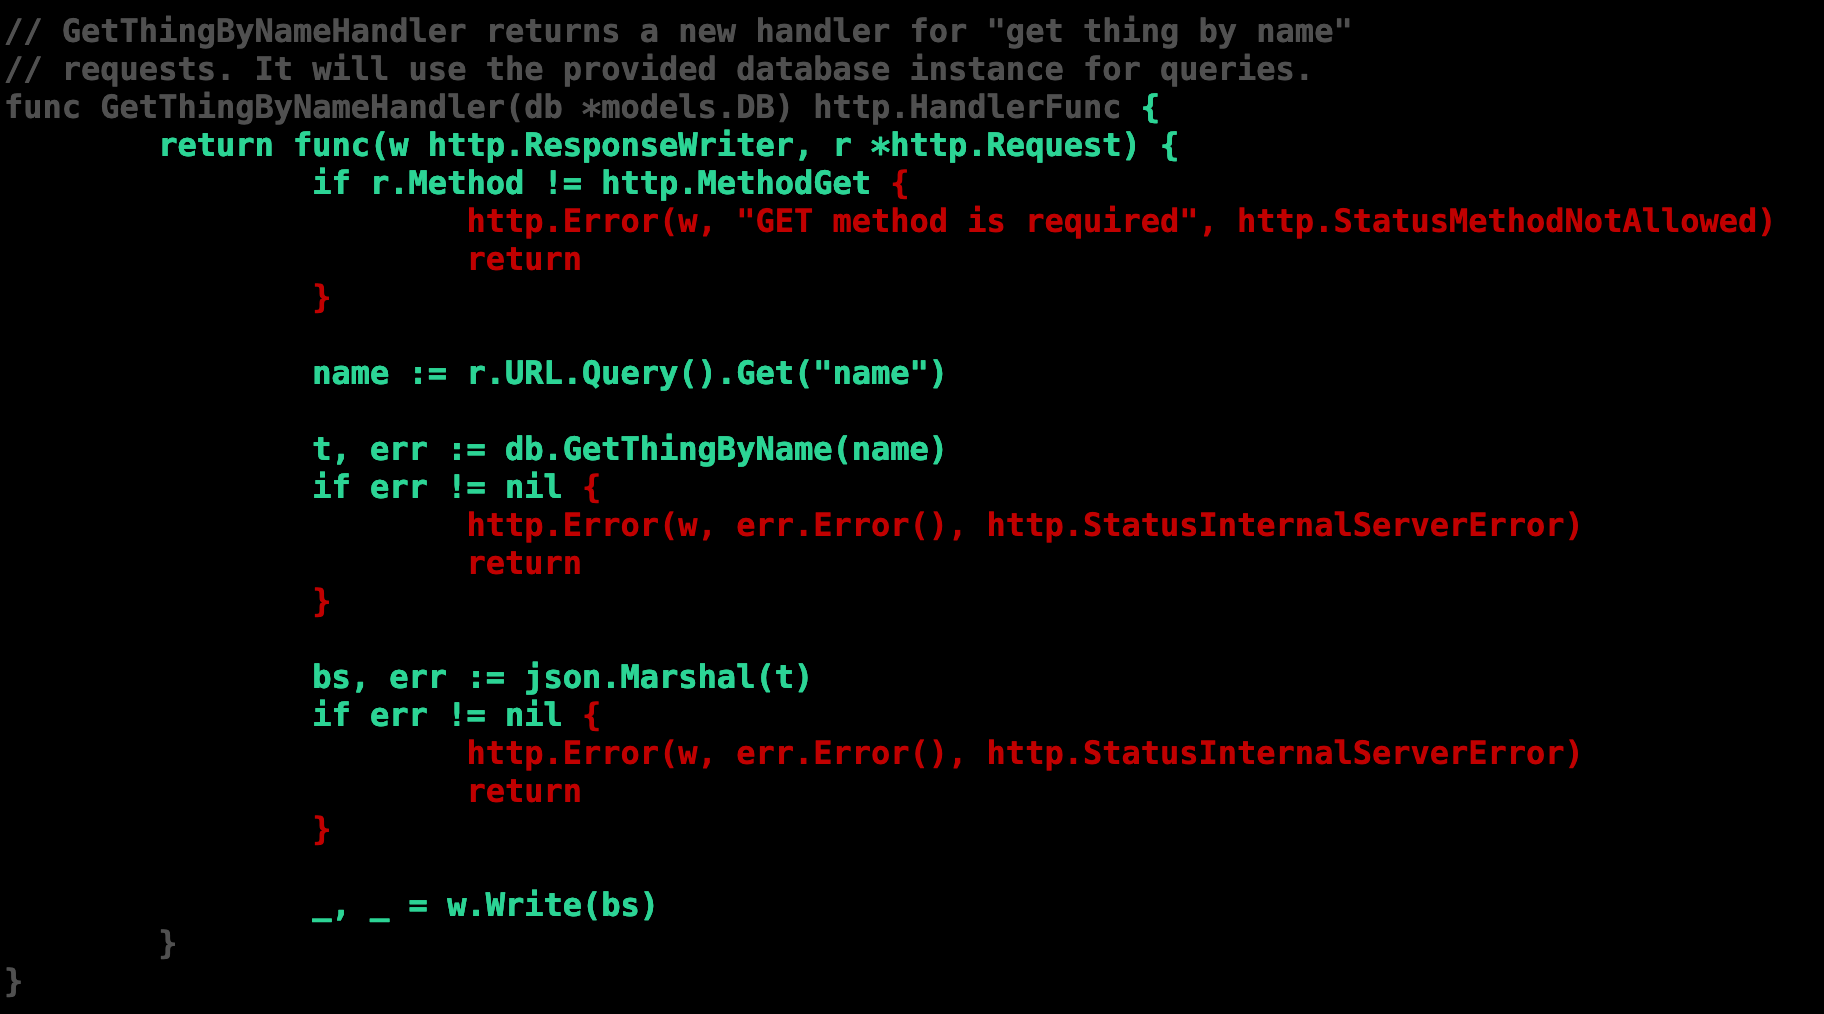
This report includes coverage for every line of code. It appears that none of the errors were tested 😿
Coverage reports can even include a heat map and tell you how many times
each line of code was hit! This option is set by default when -race flag is
used, or can be allowed with -covermode atomic flag. Read more about
supported flags here.
Viewing coverage report from the command line
Using the built-in go tool cover does the job, but the more I used it, the
more I struggled with it, especially in large codebases: the file picker at the
top does not support searching, there were no line numbers, and the code
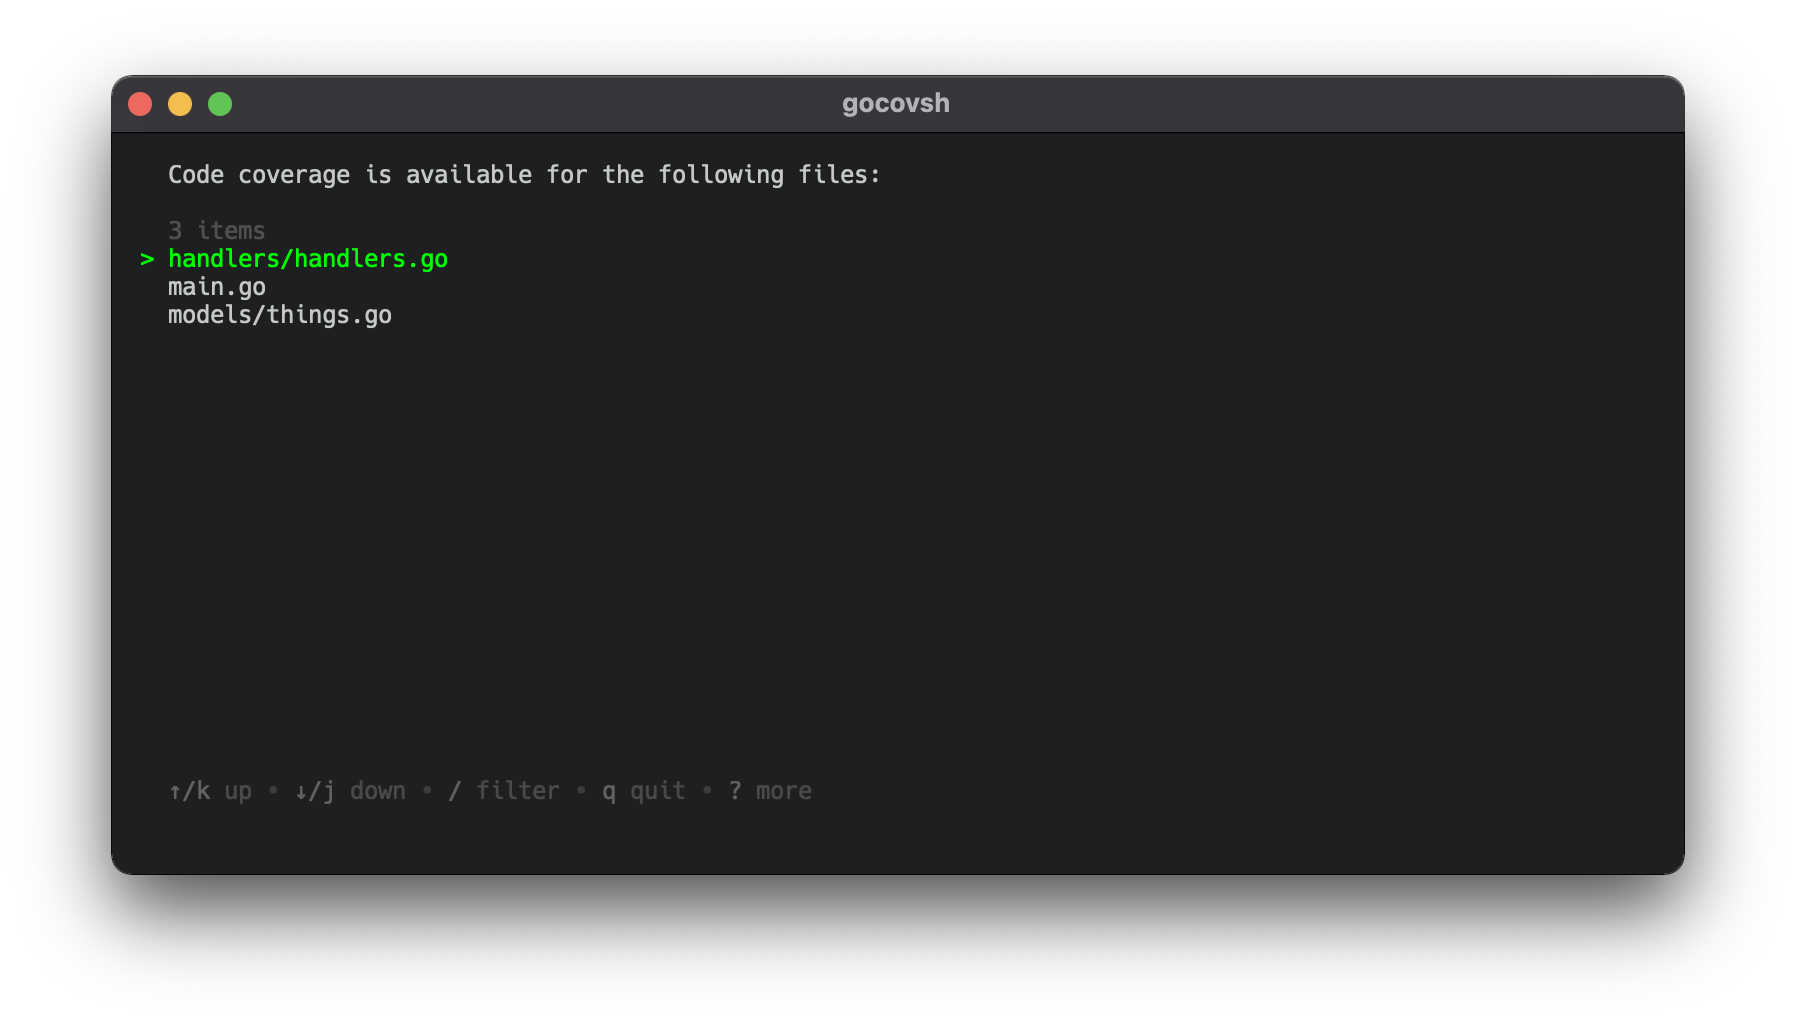
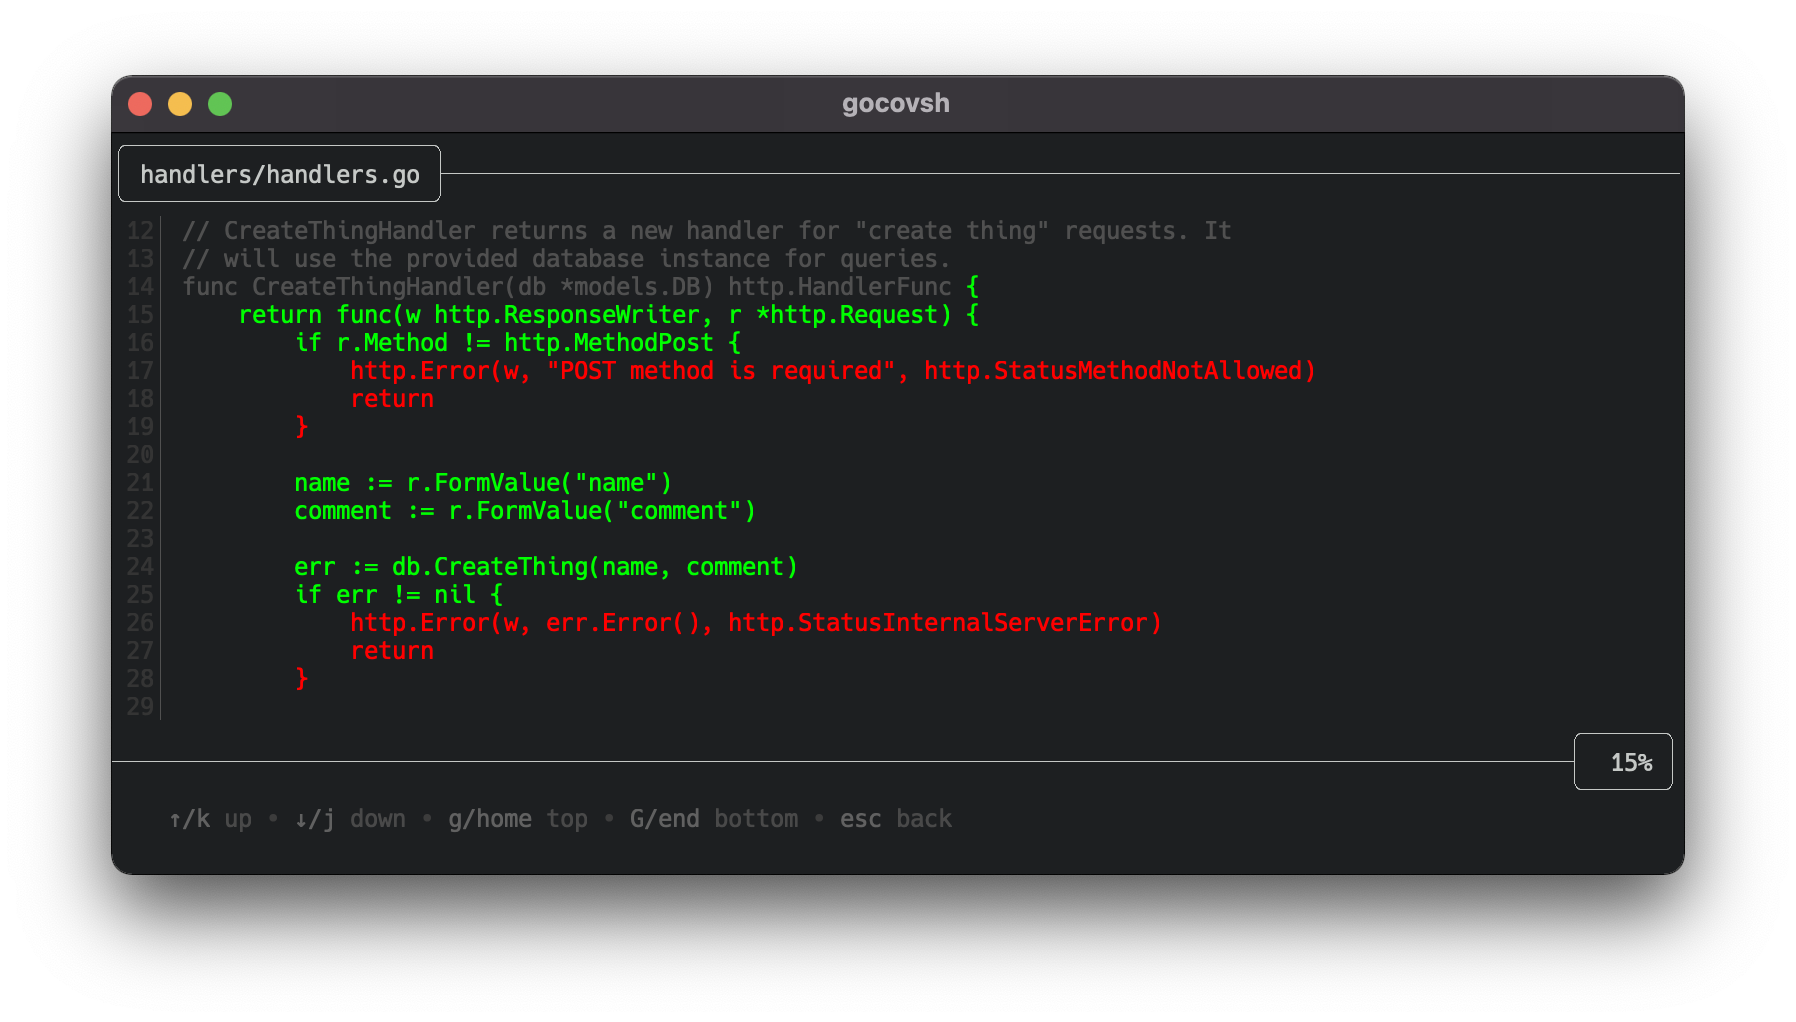
navigation was not easy. To solve some of these issues, I built
gocovsh - a CLI program to view Go
coverage reports with comfort of your own terminal:
$ brew install orlangure/tap/gocovsh
$ gocovsh
# or use a custom profile name
$ gocovsh --profile cover.profile
Bonus: a useful zsh function
I had to run Go tests with coverage so many times, that I added a simple
shortcut to my ~/.zshrc file:
function gotest {
    pkg=${1:-.}
    run=${2:-.}

    go test -v -race -coverprofile=coverage.out -coverpkg ./... "$pkg" -run "$run"
}

# usage:
#
# gotest
# gotest ./handlers
# gotest ./handlers TestThing
Summary
Integration tests are great to build confidence in your code, but coverage
reports of such tests in Go can be tricky. Use -coverpkg and -coverprofile
flags to get more details from test coverage reports, and use go tool cover -html to view the results in a browser or
gocovsh to explore the coverage
report from the CLI.
If your code relies on external services, like databases or AWS, Gnomock can be useful for writing integration or end-to-end tests.